Early differences in glucose homeostasis between diabetes type 1 versus type 2 recipients of kidney/pancreas transplants
Richard Knight1, Yan Yi1, Duc T Nguyen2, Edward A Graviss2, Archana R Sadhu3, Stephanie G Yi1, Mark J Hobeika1, Hemangshu Podder1, Osama Gaber1.
1Surgery, Houston Methodist Hospital, Houston, TX, United States; 2Pathology and Genomic Medicine, Houston Methodist Hospital, Houston, TX, United States; 3Medicine, Houston Methodist Hospital, Houston, TX, United States
Purpose: Results of pancreas transplantation are equivalent between type 1 and selected type 2 recipients with IDDM. We sought to determine differences in glucose homeostasis between groups by comparing outcomes of glucose tolerance tests in the early post-transplant period.
Methods: A retrospective single center review of IDDM recipients of kidney/pancreas transplants between 2016 and 2022. A subset of recipients underwent a modified glucose tolerance test (OGTT) between 6- and 12-months post-transplantation. Diabetes type was determined using a composite scoring system as previously published1. Variables included age at diagnosis of DM, immediate use of insulin or not, c-peptide level, presence of islet autoantibodies or not, and daily amount of insulin. OGTT results were compared between groups by calculating the mean area under the curve (AUC) and peak glucose, insulin, and c-peptide levels.
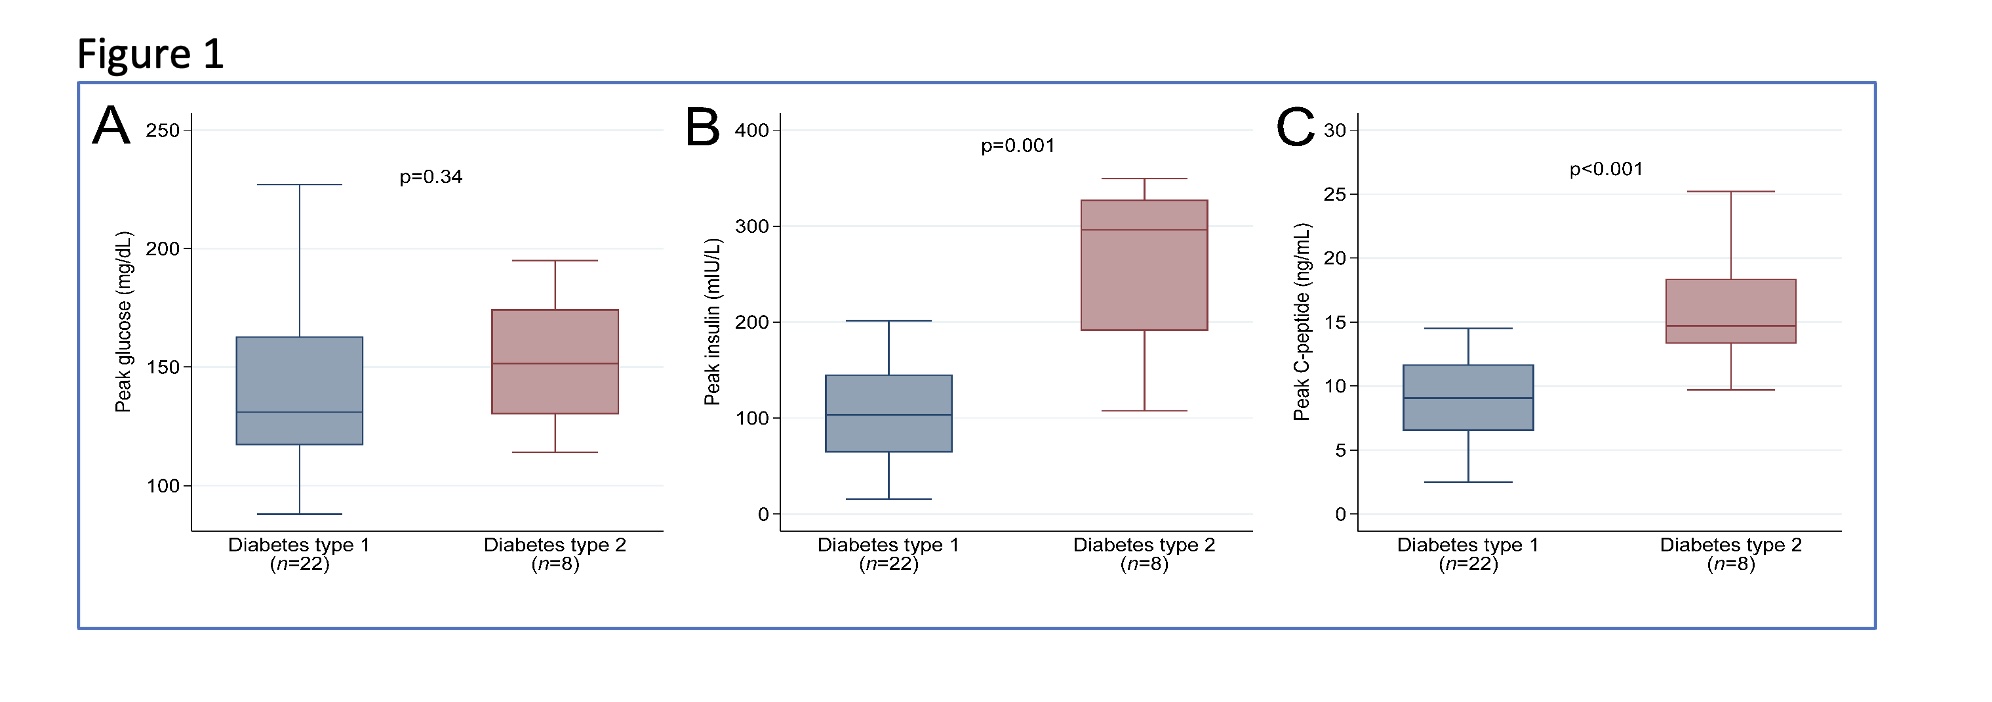
Results: Demographics of the study group (n=72) included a mean age of 44.5 years, 65 percent male, and BMI of 25.2mg/m2. Baseline characteristics of age, gender, race, years of diabetes, dialysis history, and BMI were equivalent between groups. There were 59 recipients with type 1 and 13 recipients with type 2 diabetes. At one year post-transplant, for type 1 versus type 2 recipients; mean fasting glucose levels (91±13 versus 88±13 mg/dl), mean HgbA1c (5.4±0.6 vs 5.5±0.6%,) and pancreas graft survivals were equivalent (p:ns). The mean BMI of type 1 recipients increased from 25.04±3.26 at transplant to 25.32±4.11 at one year versus 25.84 ±1.55 to 29.4 ±6.67 kg/m among type 2 recipients. As shown in Table 1 and Figure 1; 22 type 1 and 8 type 2 recipients underwent an OGTT between 6- and 12-months post-transplant. Whereas mean glucose AUC and peak glucose levels were equivalent between groups, both the mean insulin and c-peptide AUC and peak insulin and c-peptide levels of the type 2 recipients were significantly greater than that of the type 1 recipients.
Conclusions: The fasting glucose, HgbA1c levels, and graft survivals were equivalent between type 1 and 2 pancreas recipients at one year, yet the OGTT results showed that glucose homeostasis between groups was fundamentally different. Type 2 recipients demonstrated insulin resistance early post-transplant, necessitating a much greater insulin response to a glucose challenge compared to type 1 recipients. This was accompanied by a greater weight gain in type 2 recipients at year one.


[1] 1: Pham et al. AJT. 2021(8): 2810.